
Know when your strategy works
Upload your TradingView Strategy Tester export and see your results broken down by hour, day, and session in seconds. No coding, no spreadsheets.
7-day free trial for new subscribers · Cancel any time
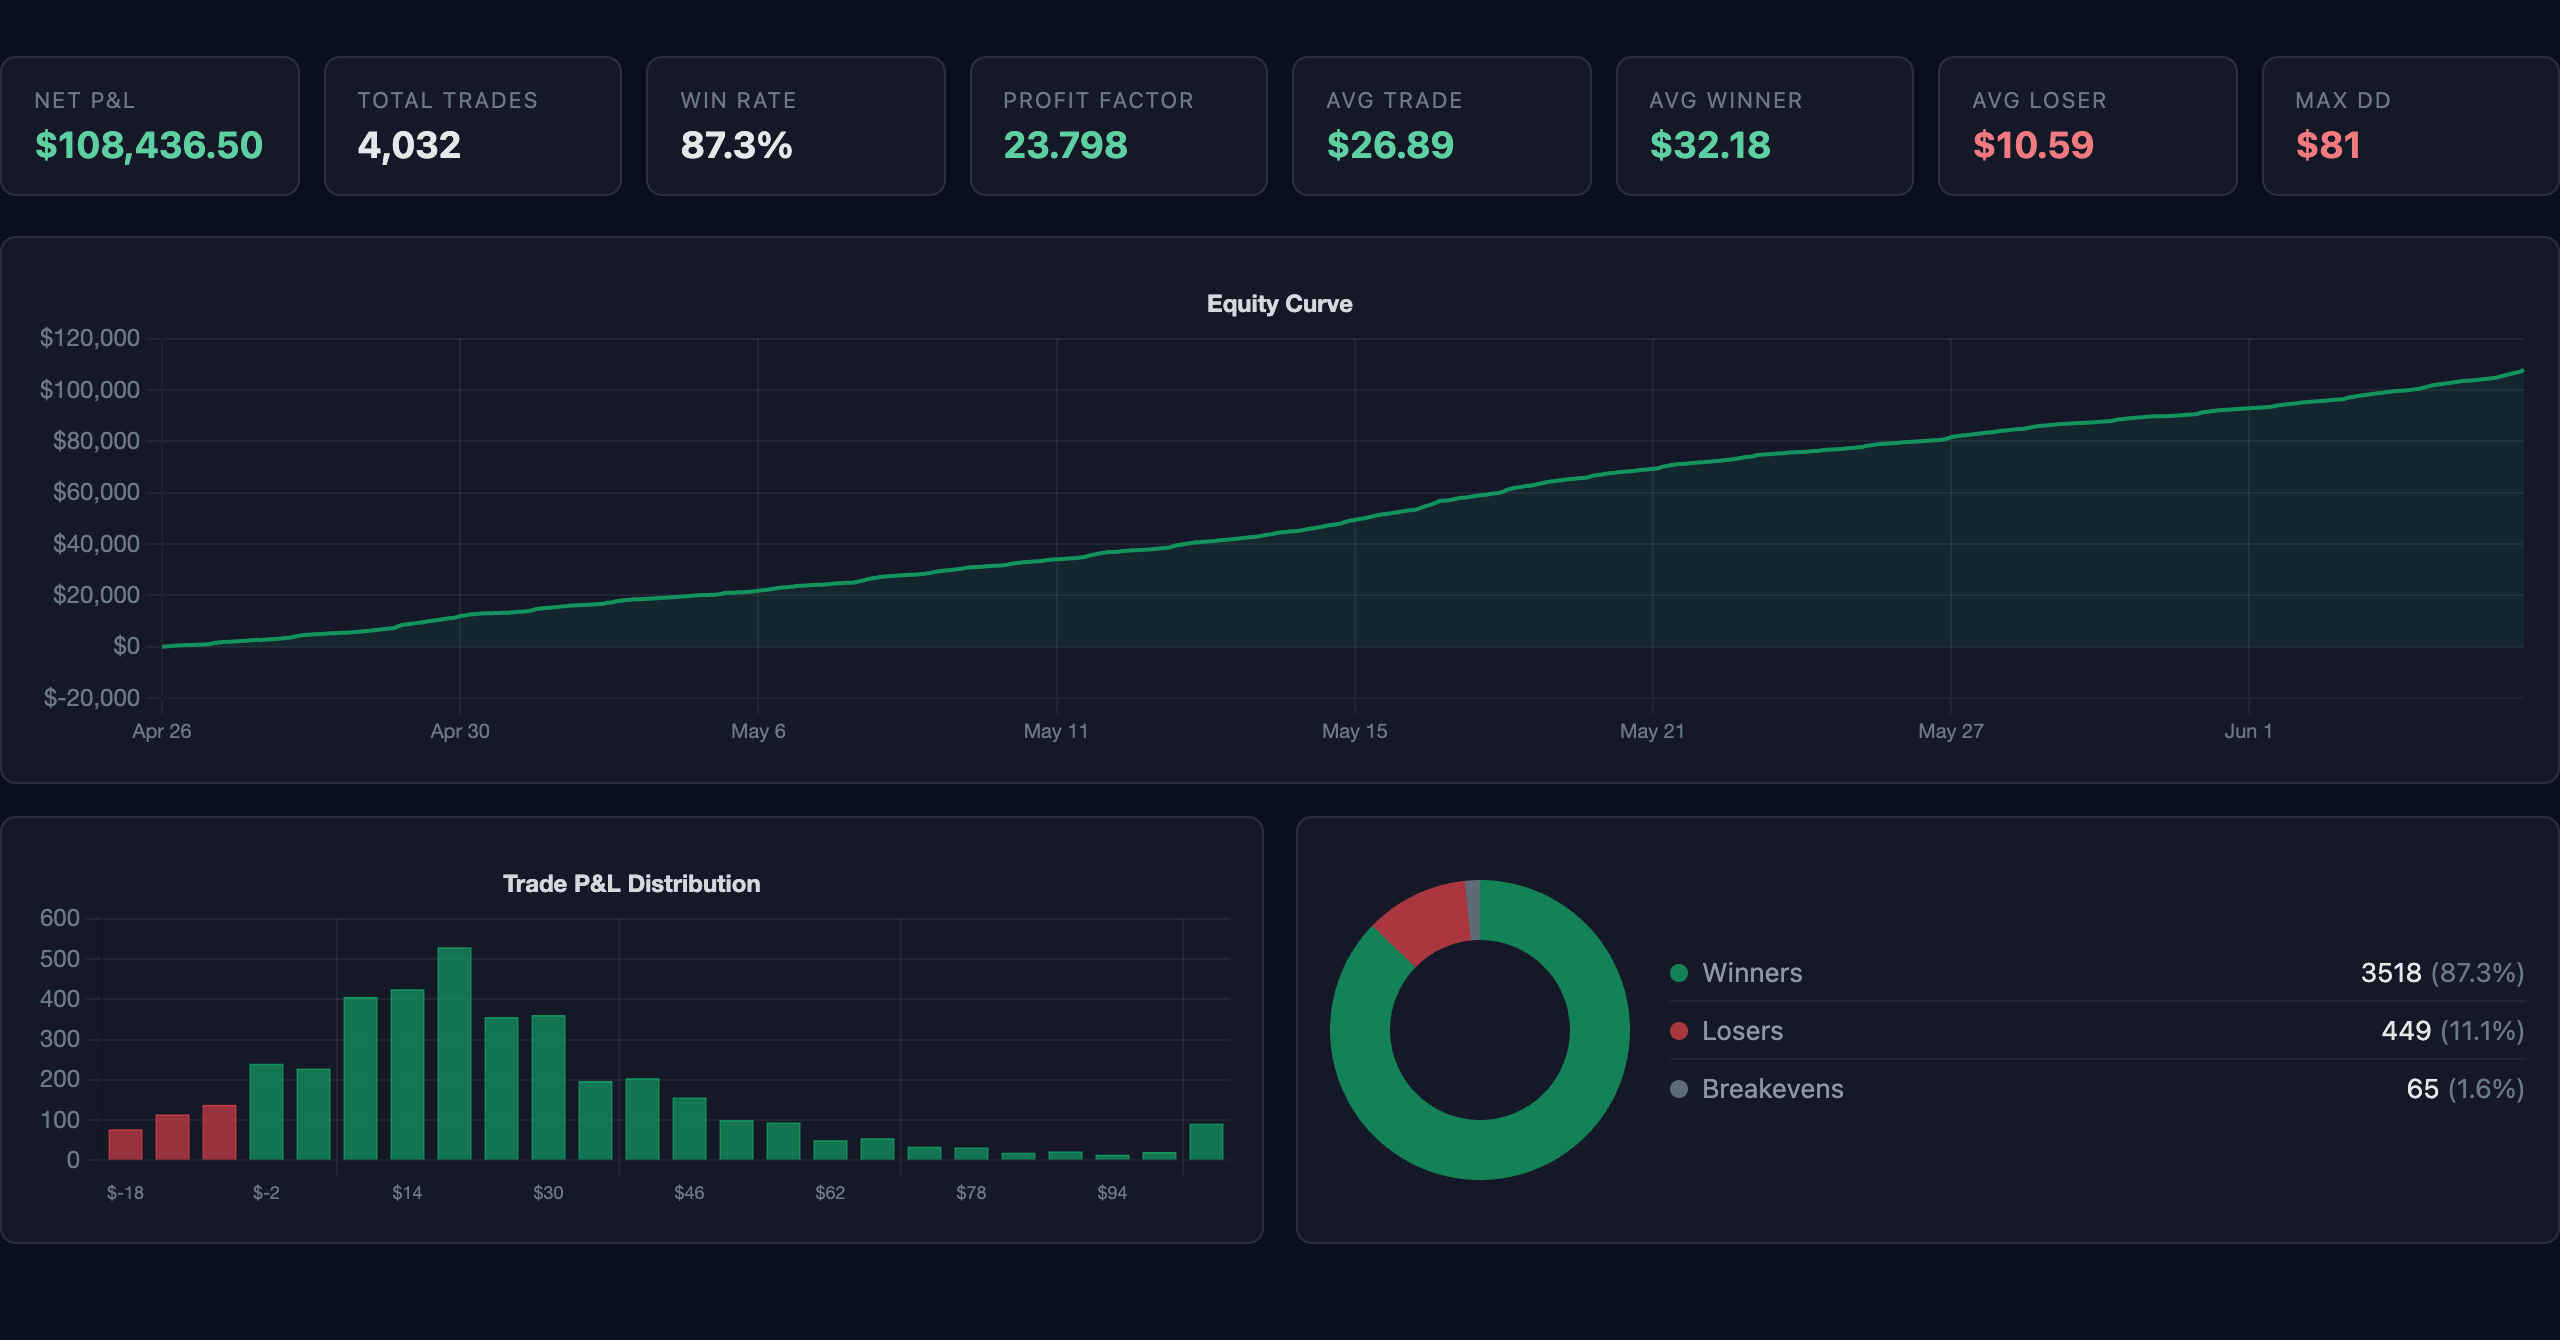
One upload. Eight tabs. Here's the tour.
Everything below is the actual tool, running a real 4,000-trade backtest.
The five-second read
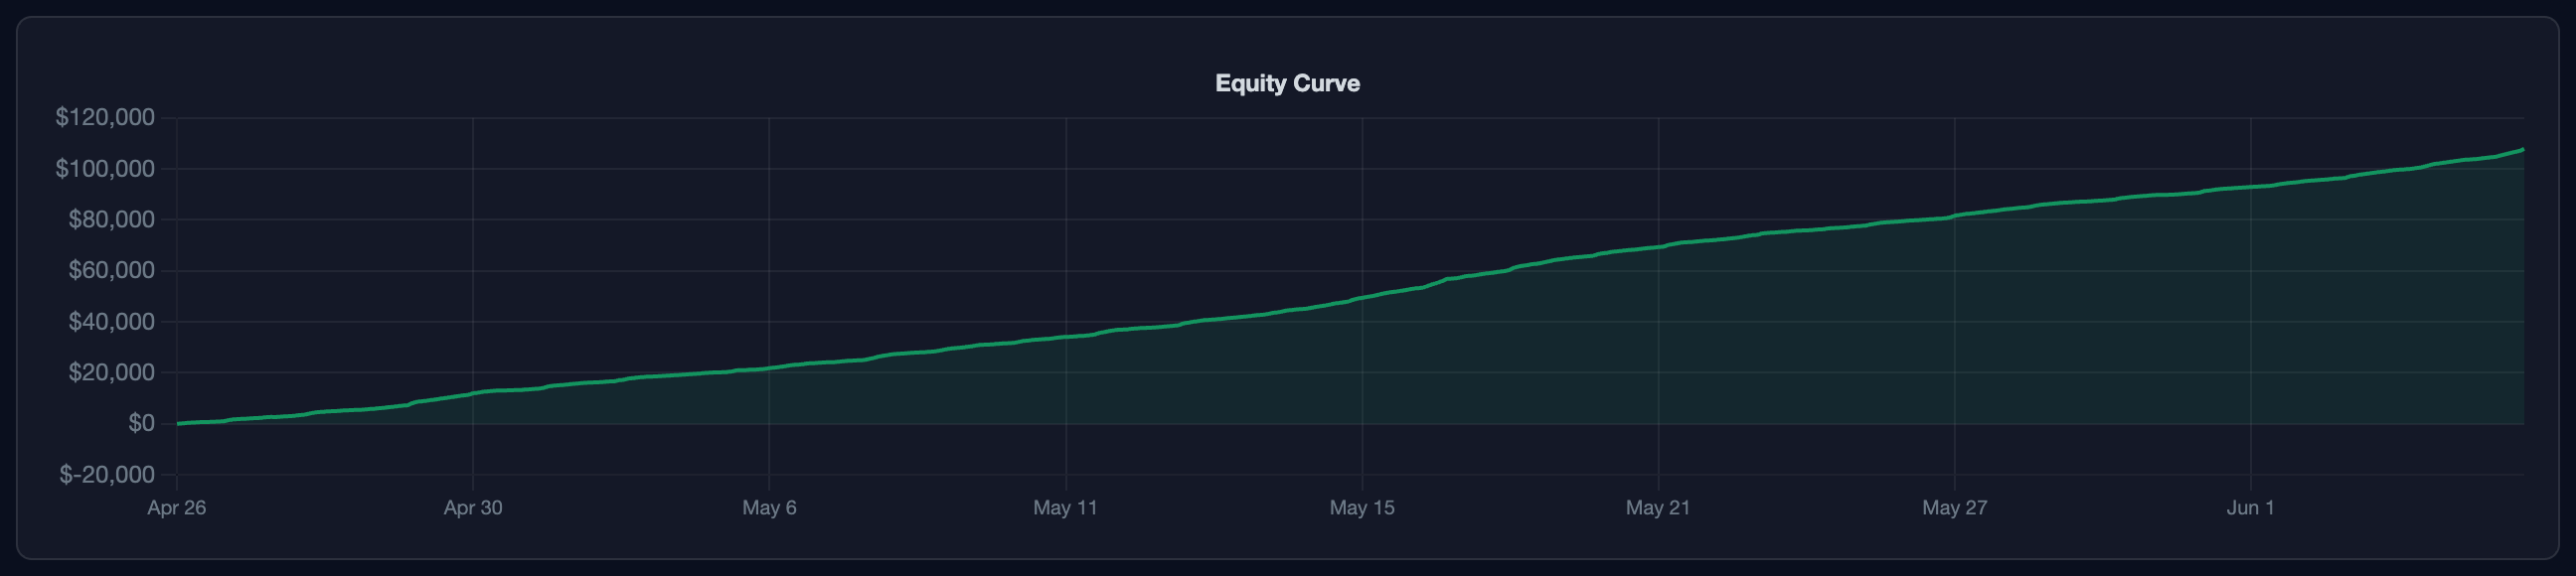
Net P&L, win rate, profit factor, average trade, and max drawdown, plus the equity curve and where your trades land. If a backtest is junk, you'll know before you scroll.


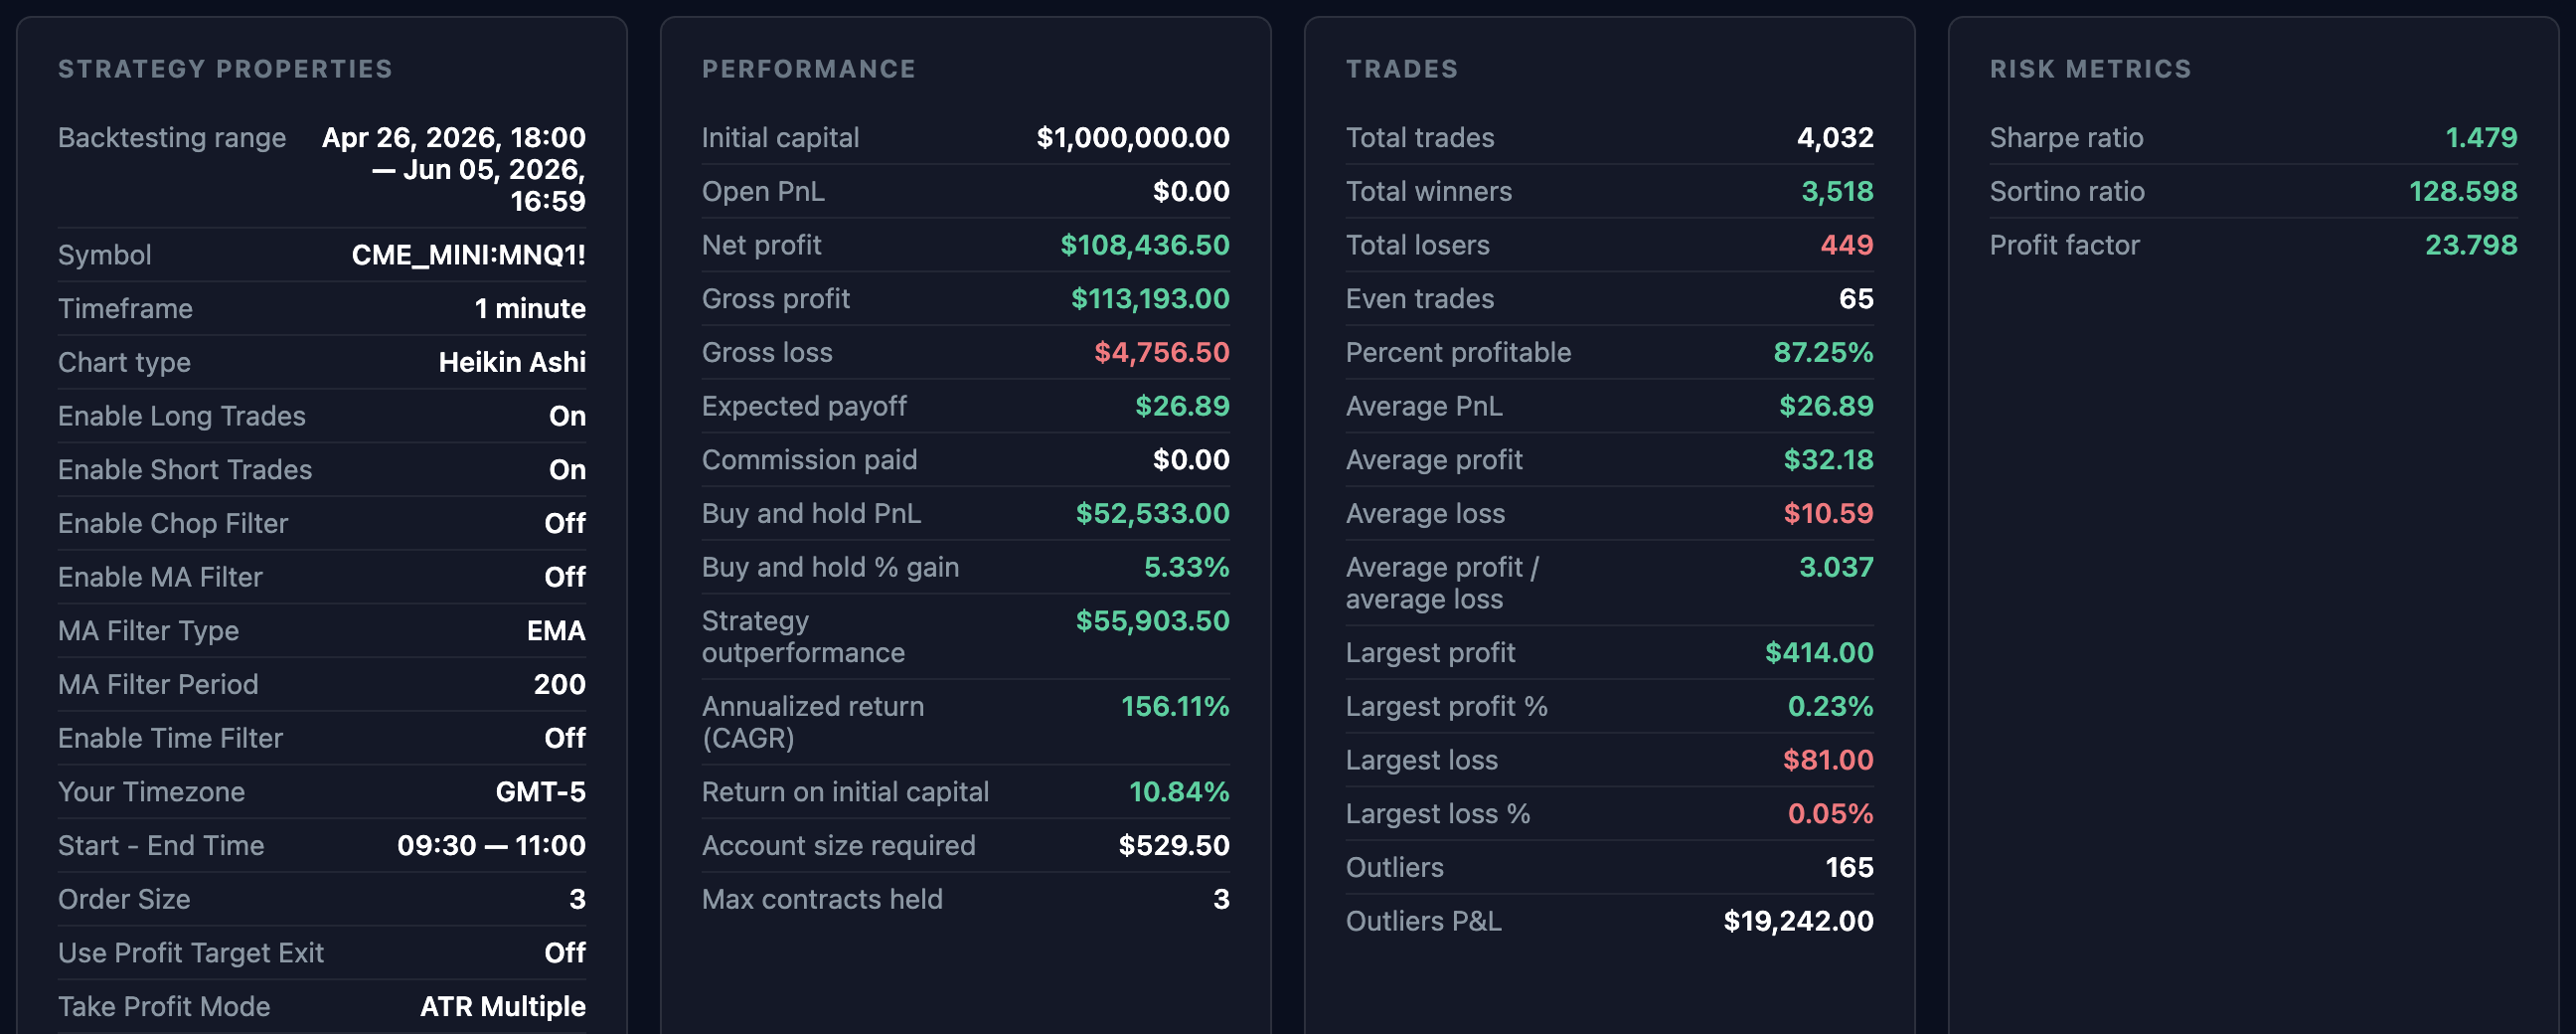
The full report, minus the wall of cells
Everything from the TradingView report, laid out in cards you can read at a glance. Risk ratios, streaks, long vs. short split, and the exact strategy properties the backtest ran with.

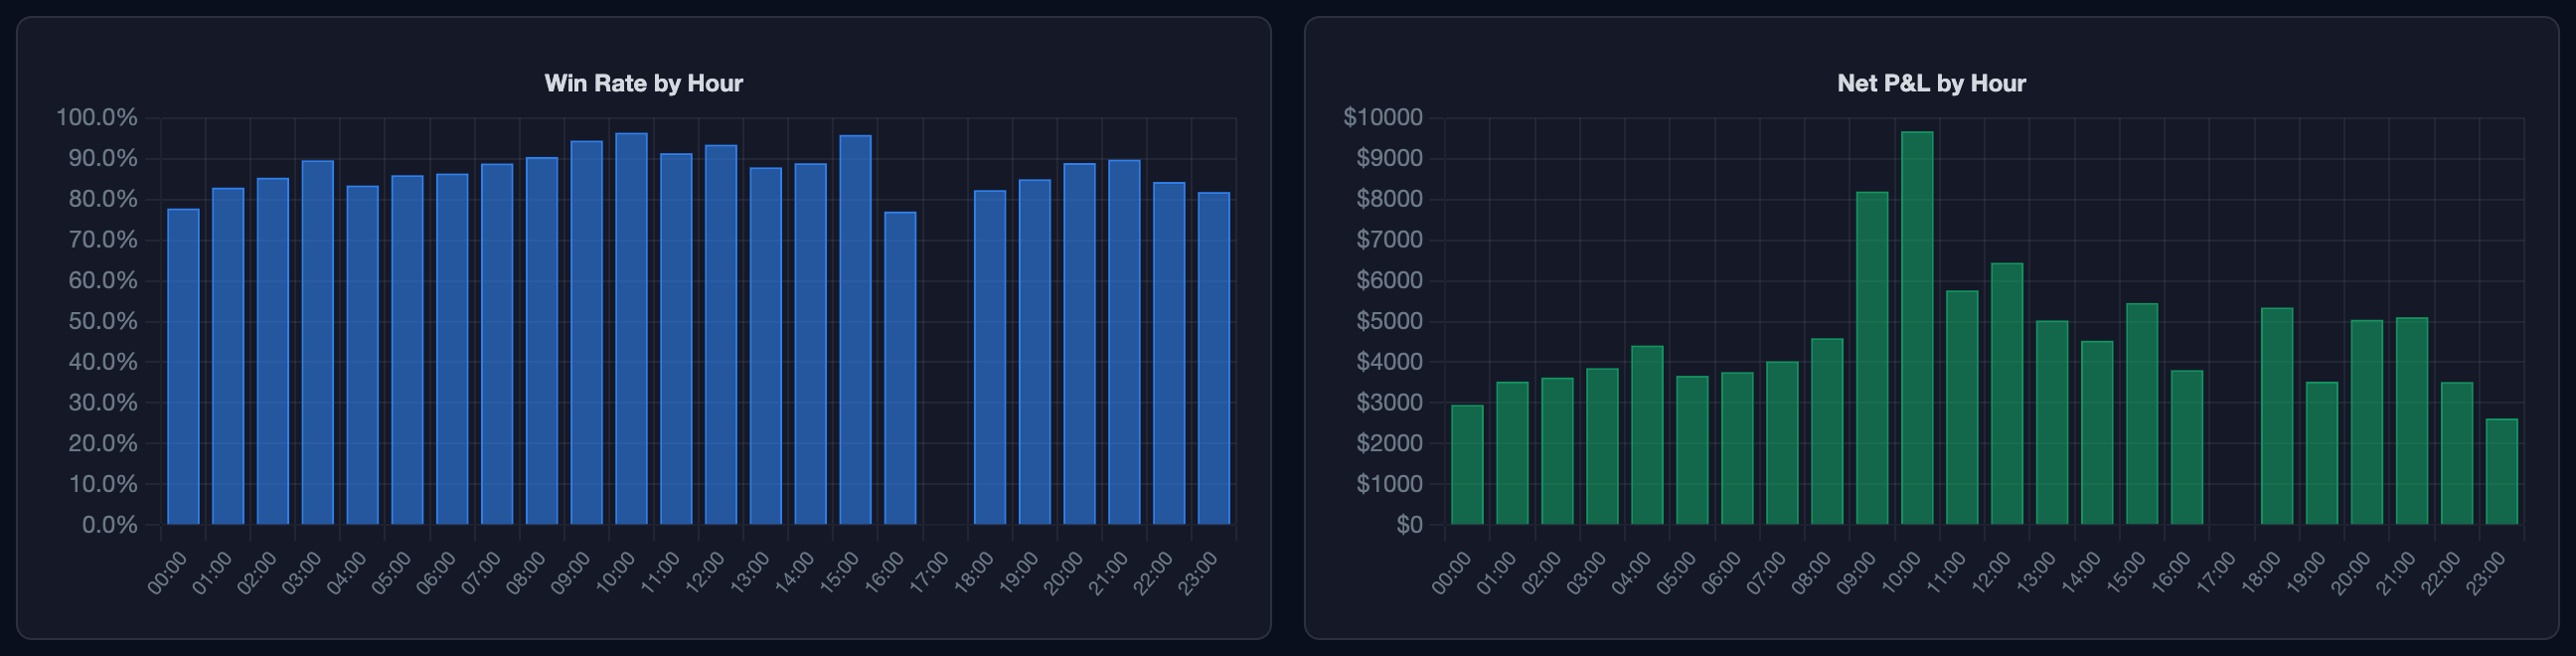
Find the hours that actually pay
This is the tab that pays for the tool. Win rate and net P&L for every hour of the day. Click the hours you care about, or hit the Market hours or Globex presets, and every stat recalculates on the spot. When you've found your window, copy the session string straight into your strategy's inputs.
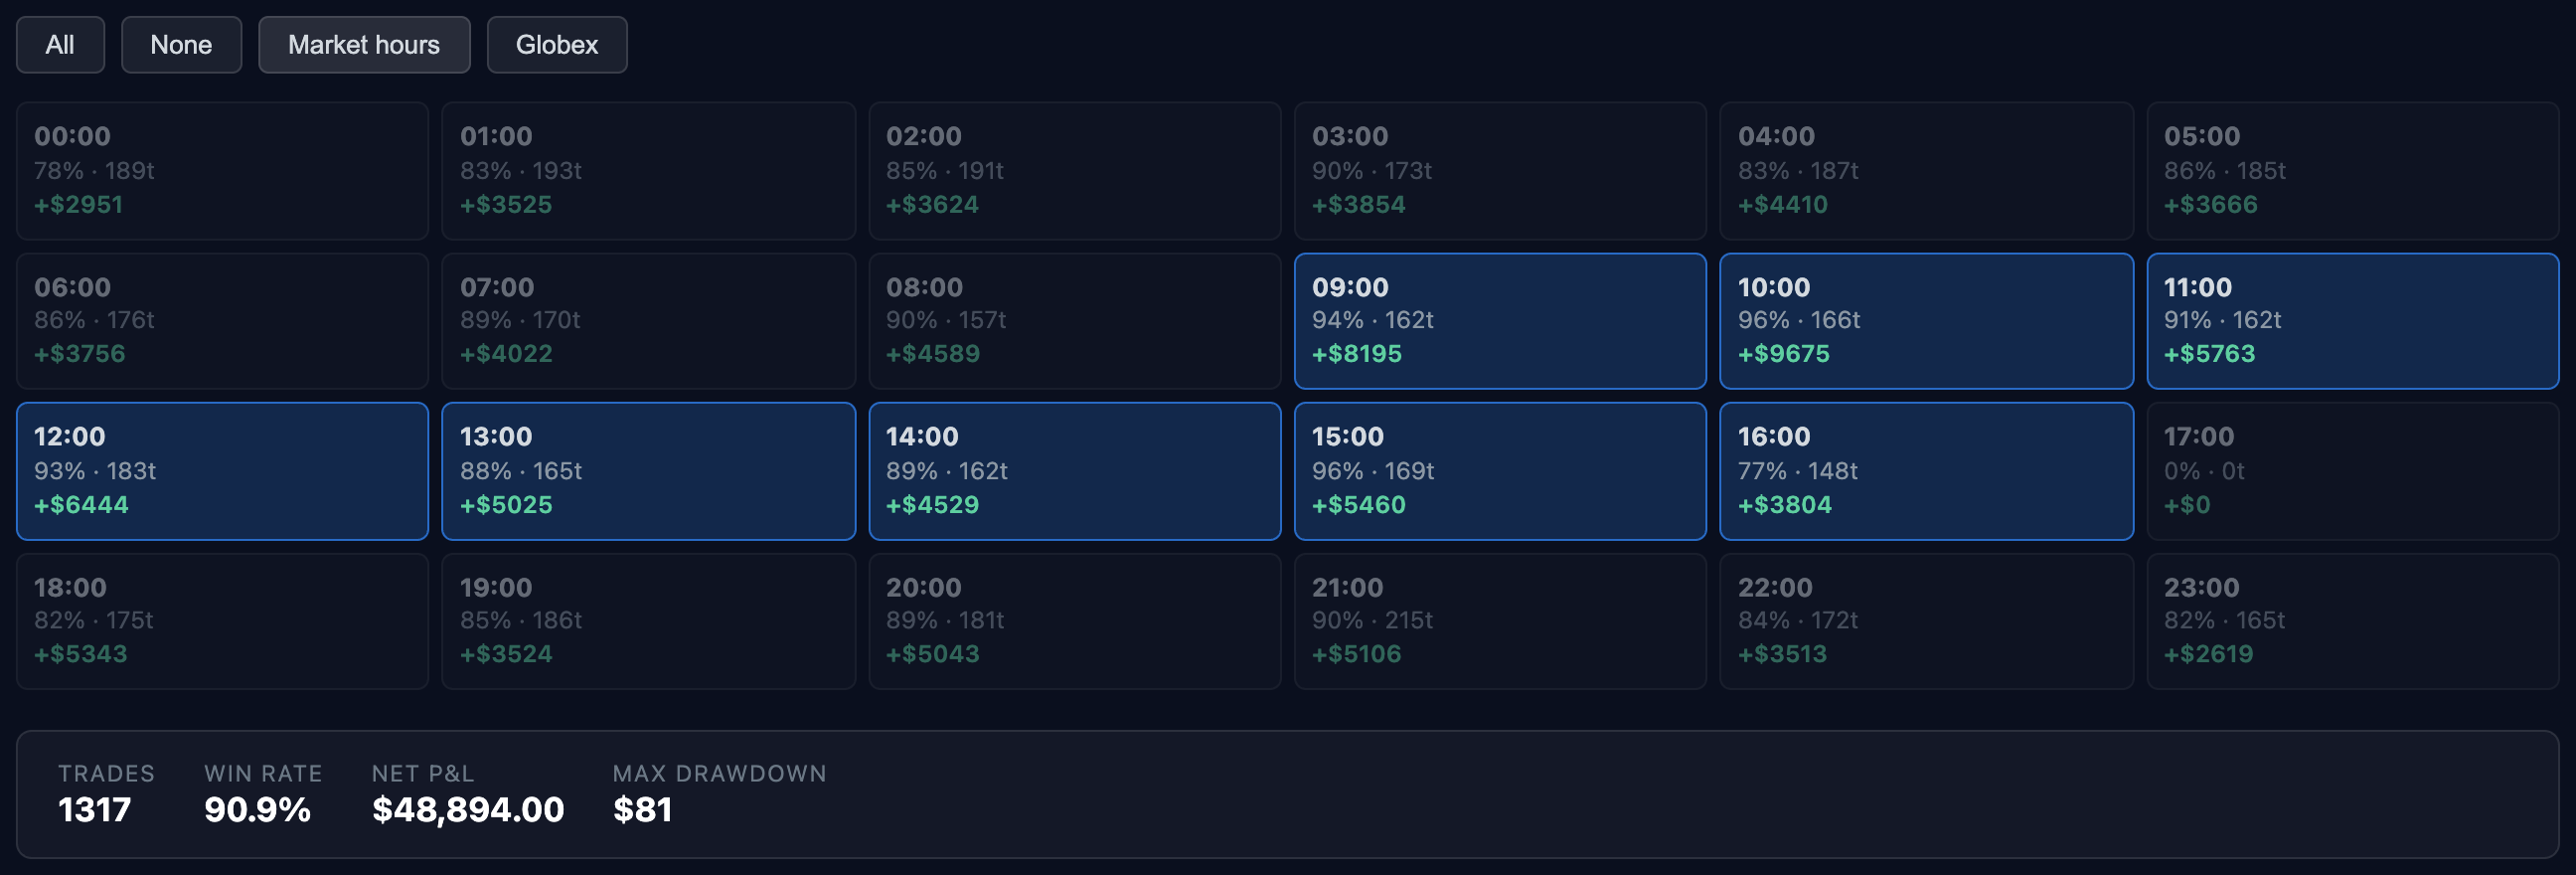

That last strip is the session string. Paste it into your TradingView strategy and trade only the hours that work.
Same idea, by weekday
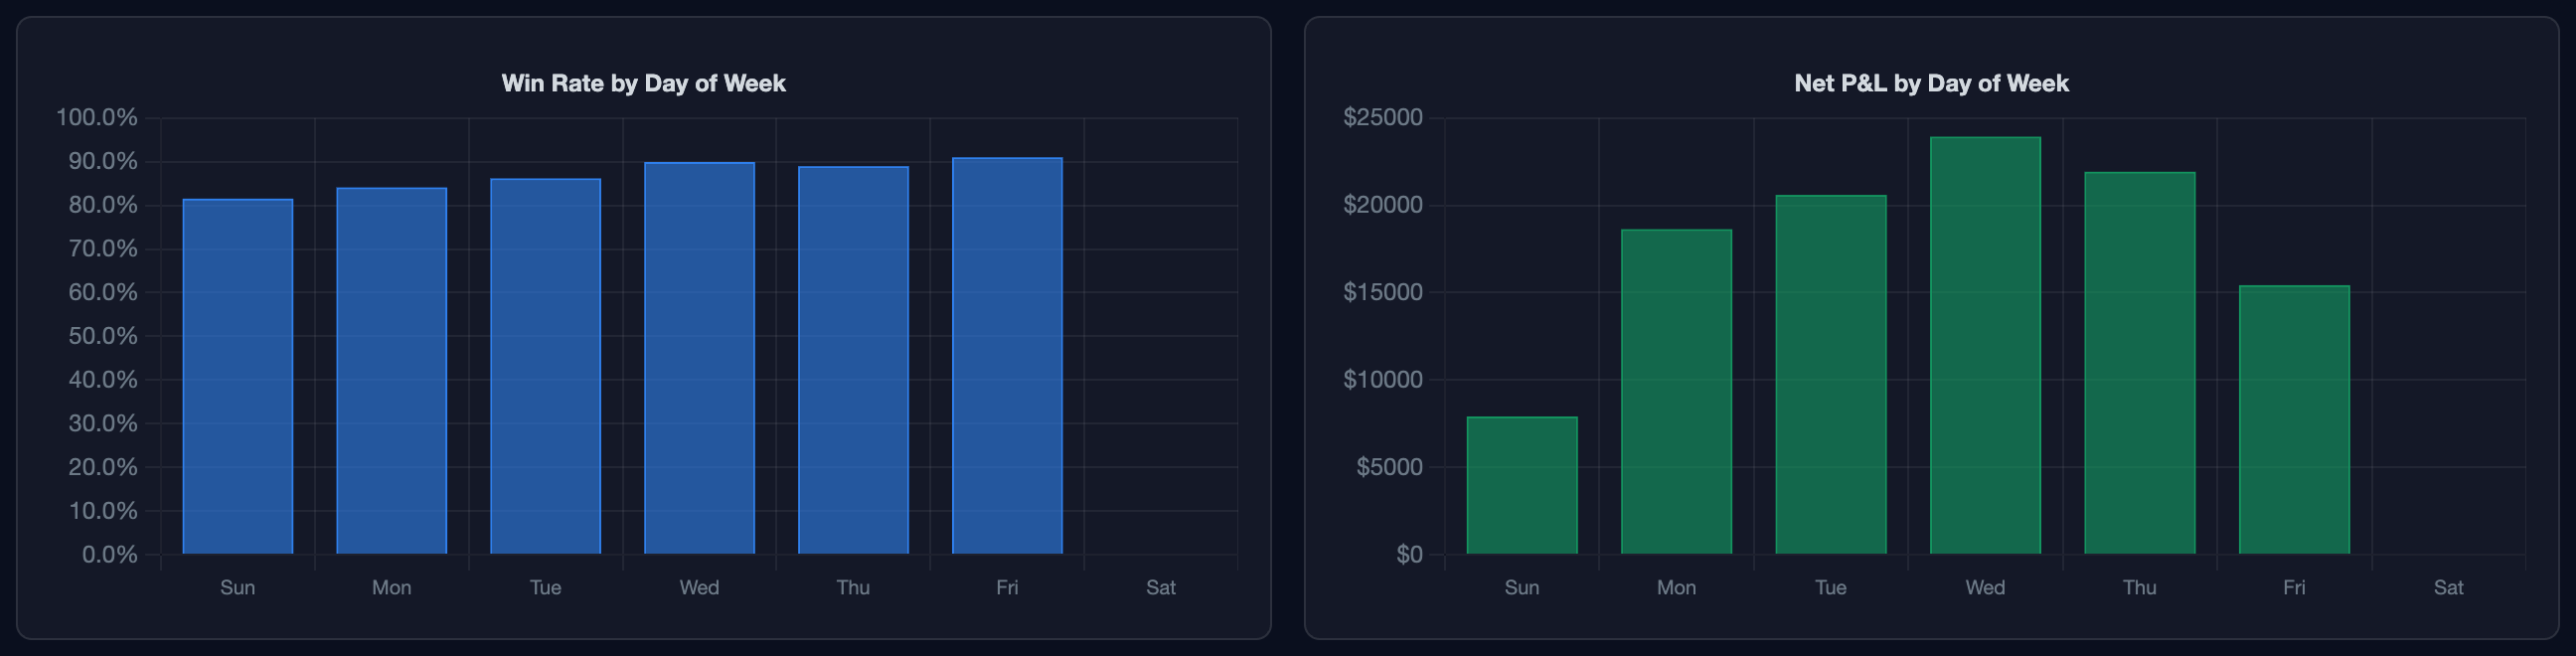
Win rate and P&L for each day of the week, with the same click-to-filter cells. Maybe your strategy hates Fridays. Now you'll know for sure.

Put it together and prove it
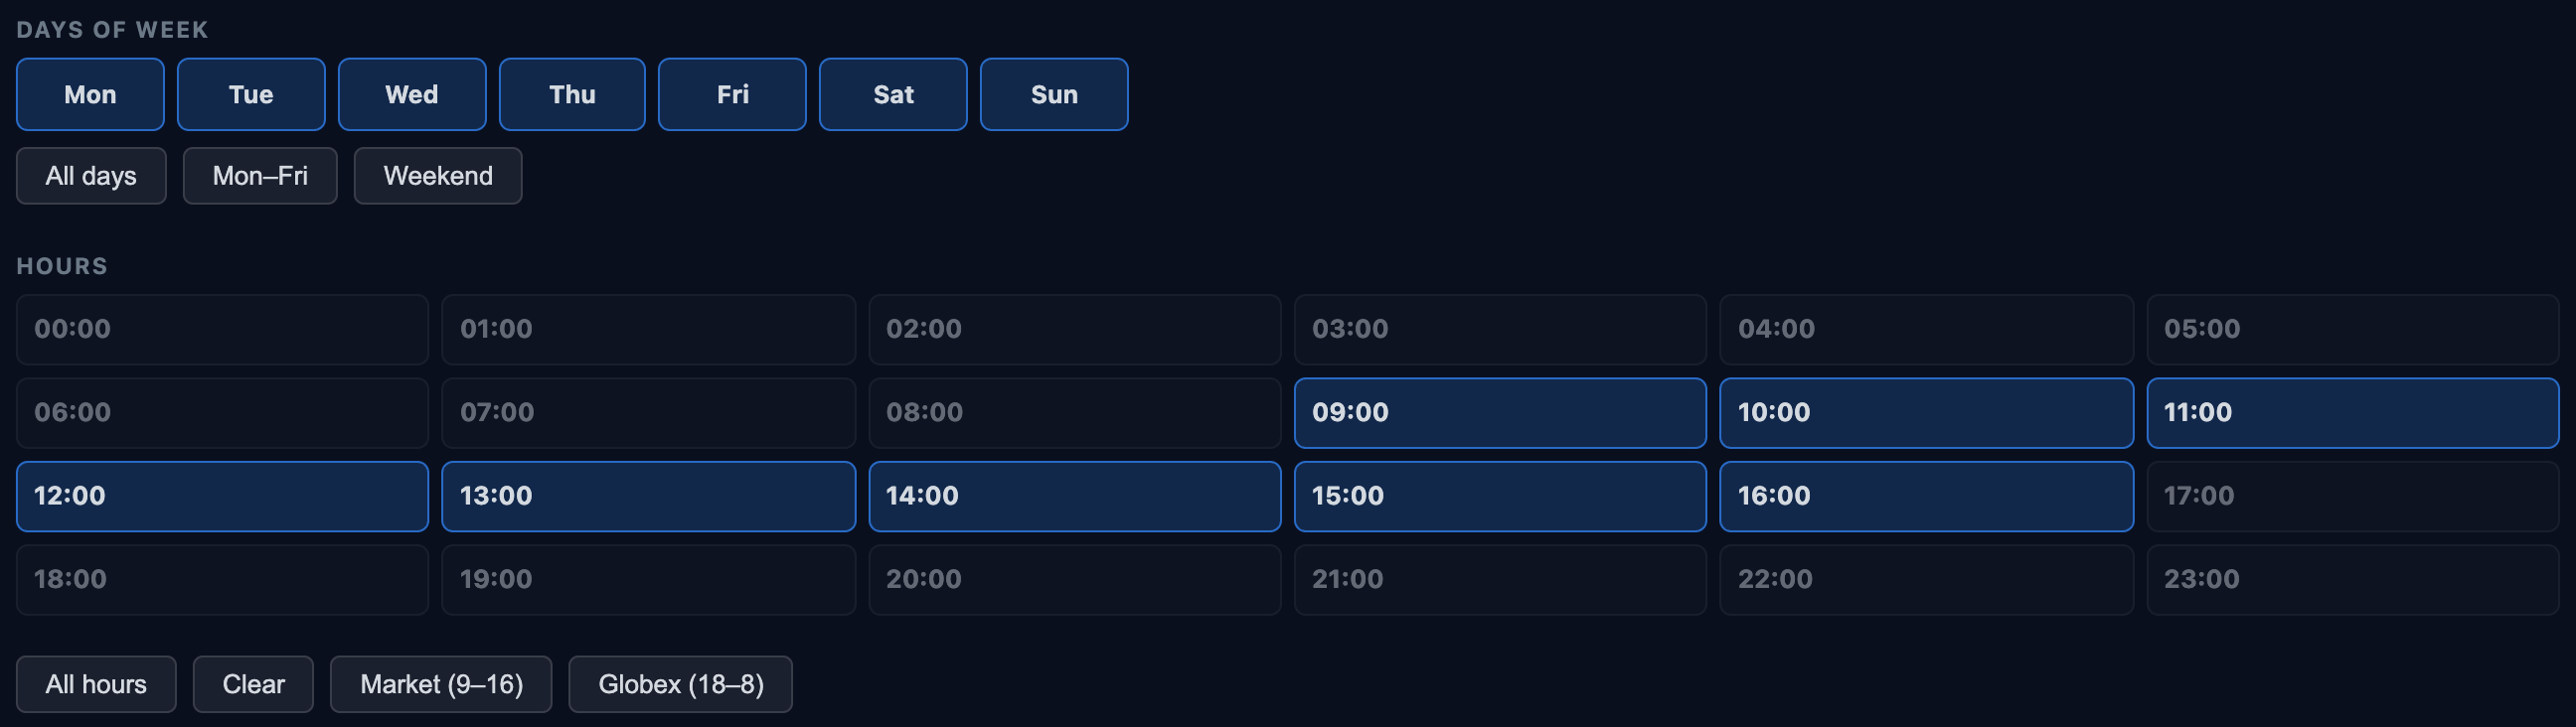
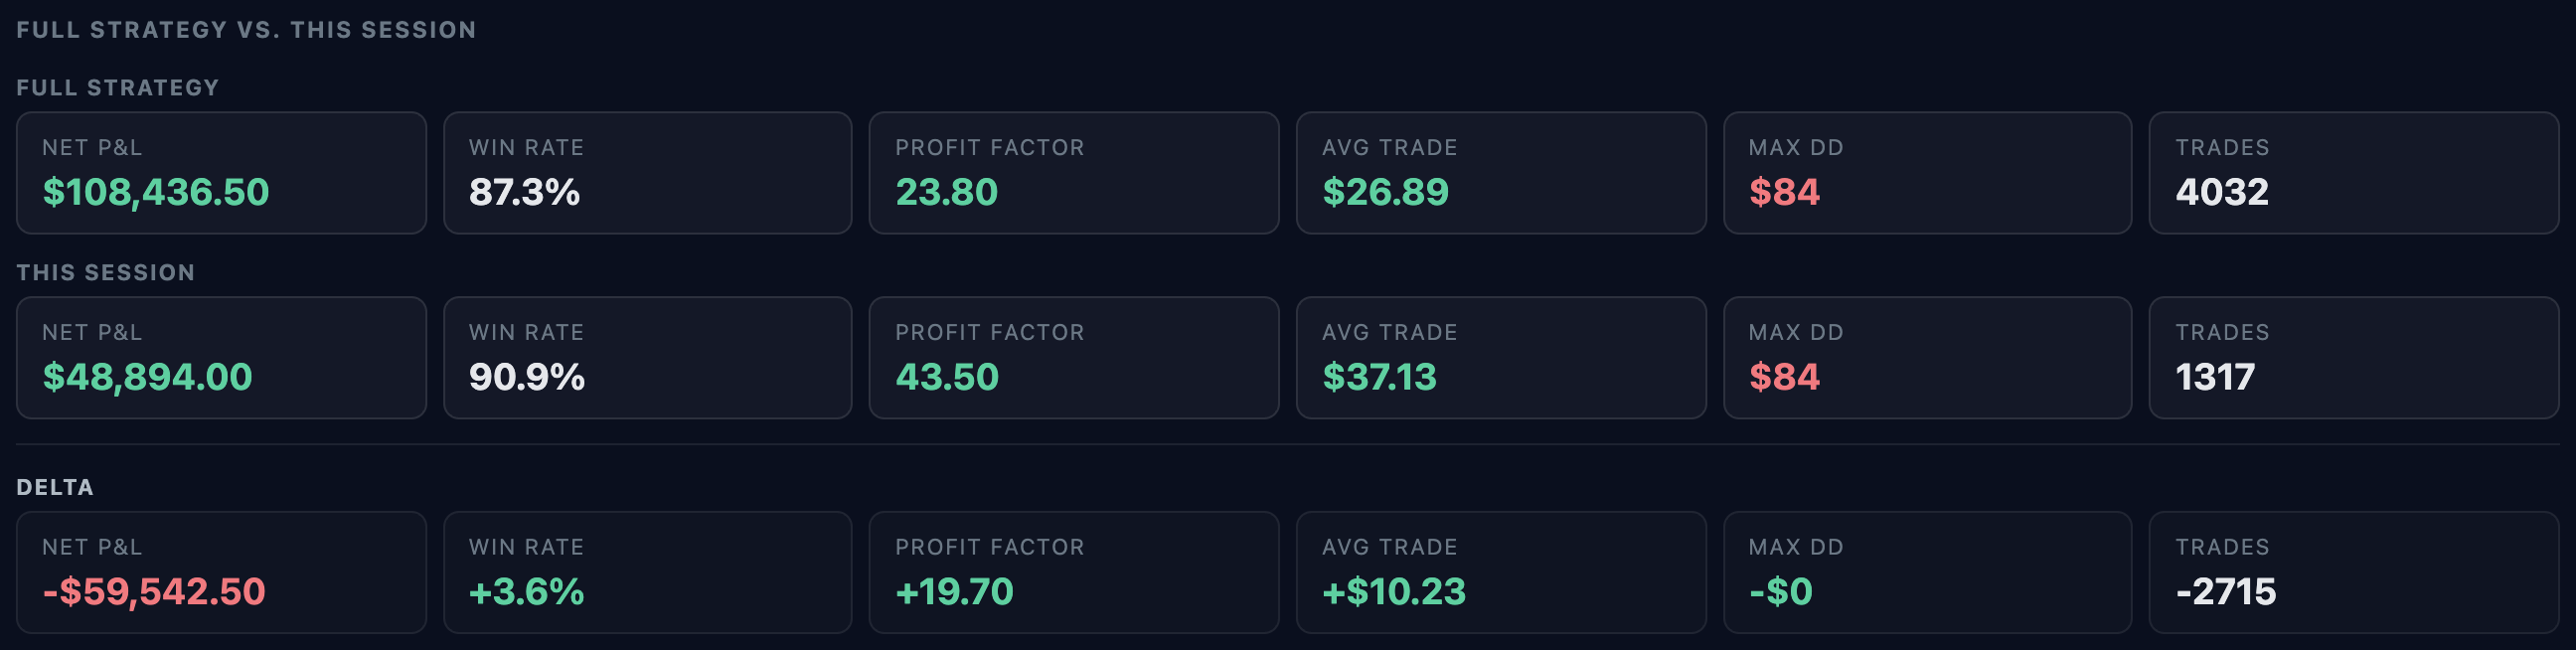
Combine any days with any hours and get a full re-run for just those trades, side by side with the whole strategy and a delta row. In the shot below, trading market hours only gives up some total P&L but wins more often, nearly doubles the profit factor, and takes better trades on average.
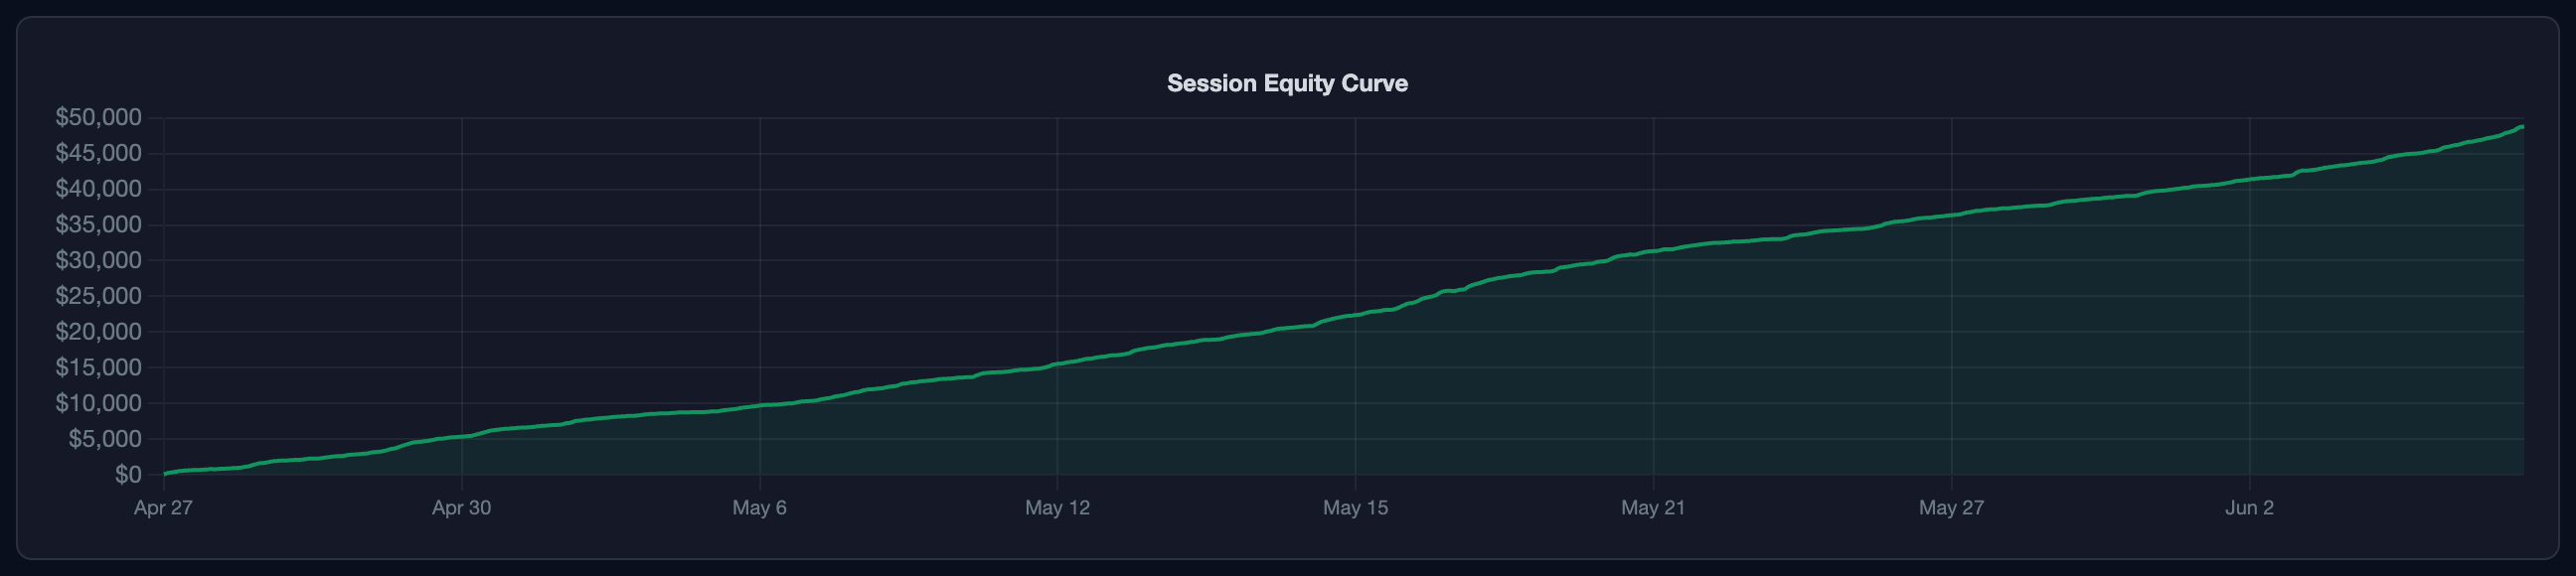
Daily P&L, month by month
Every trading day on a calendar, green or red, with monthly totals. Losing weeks and dead stretches stick out immediately.
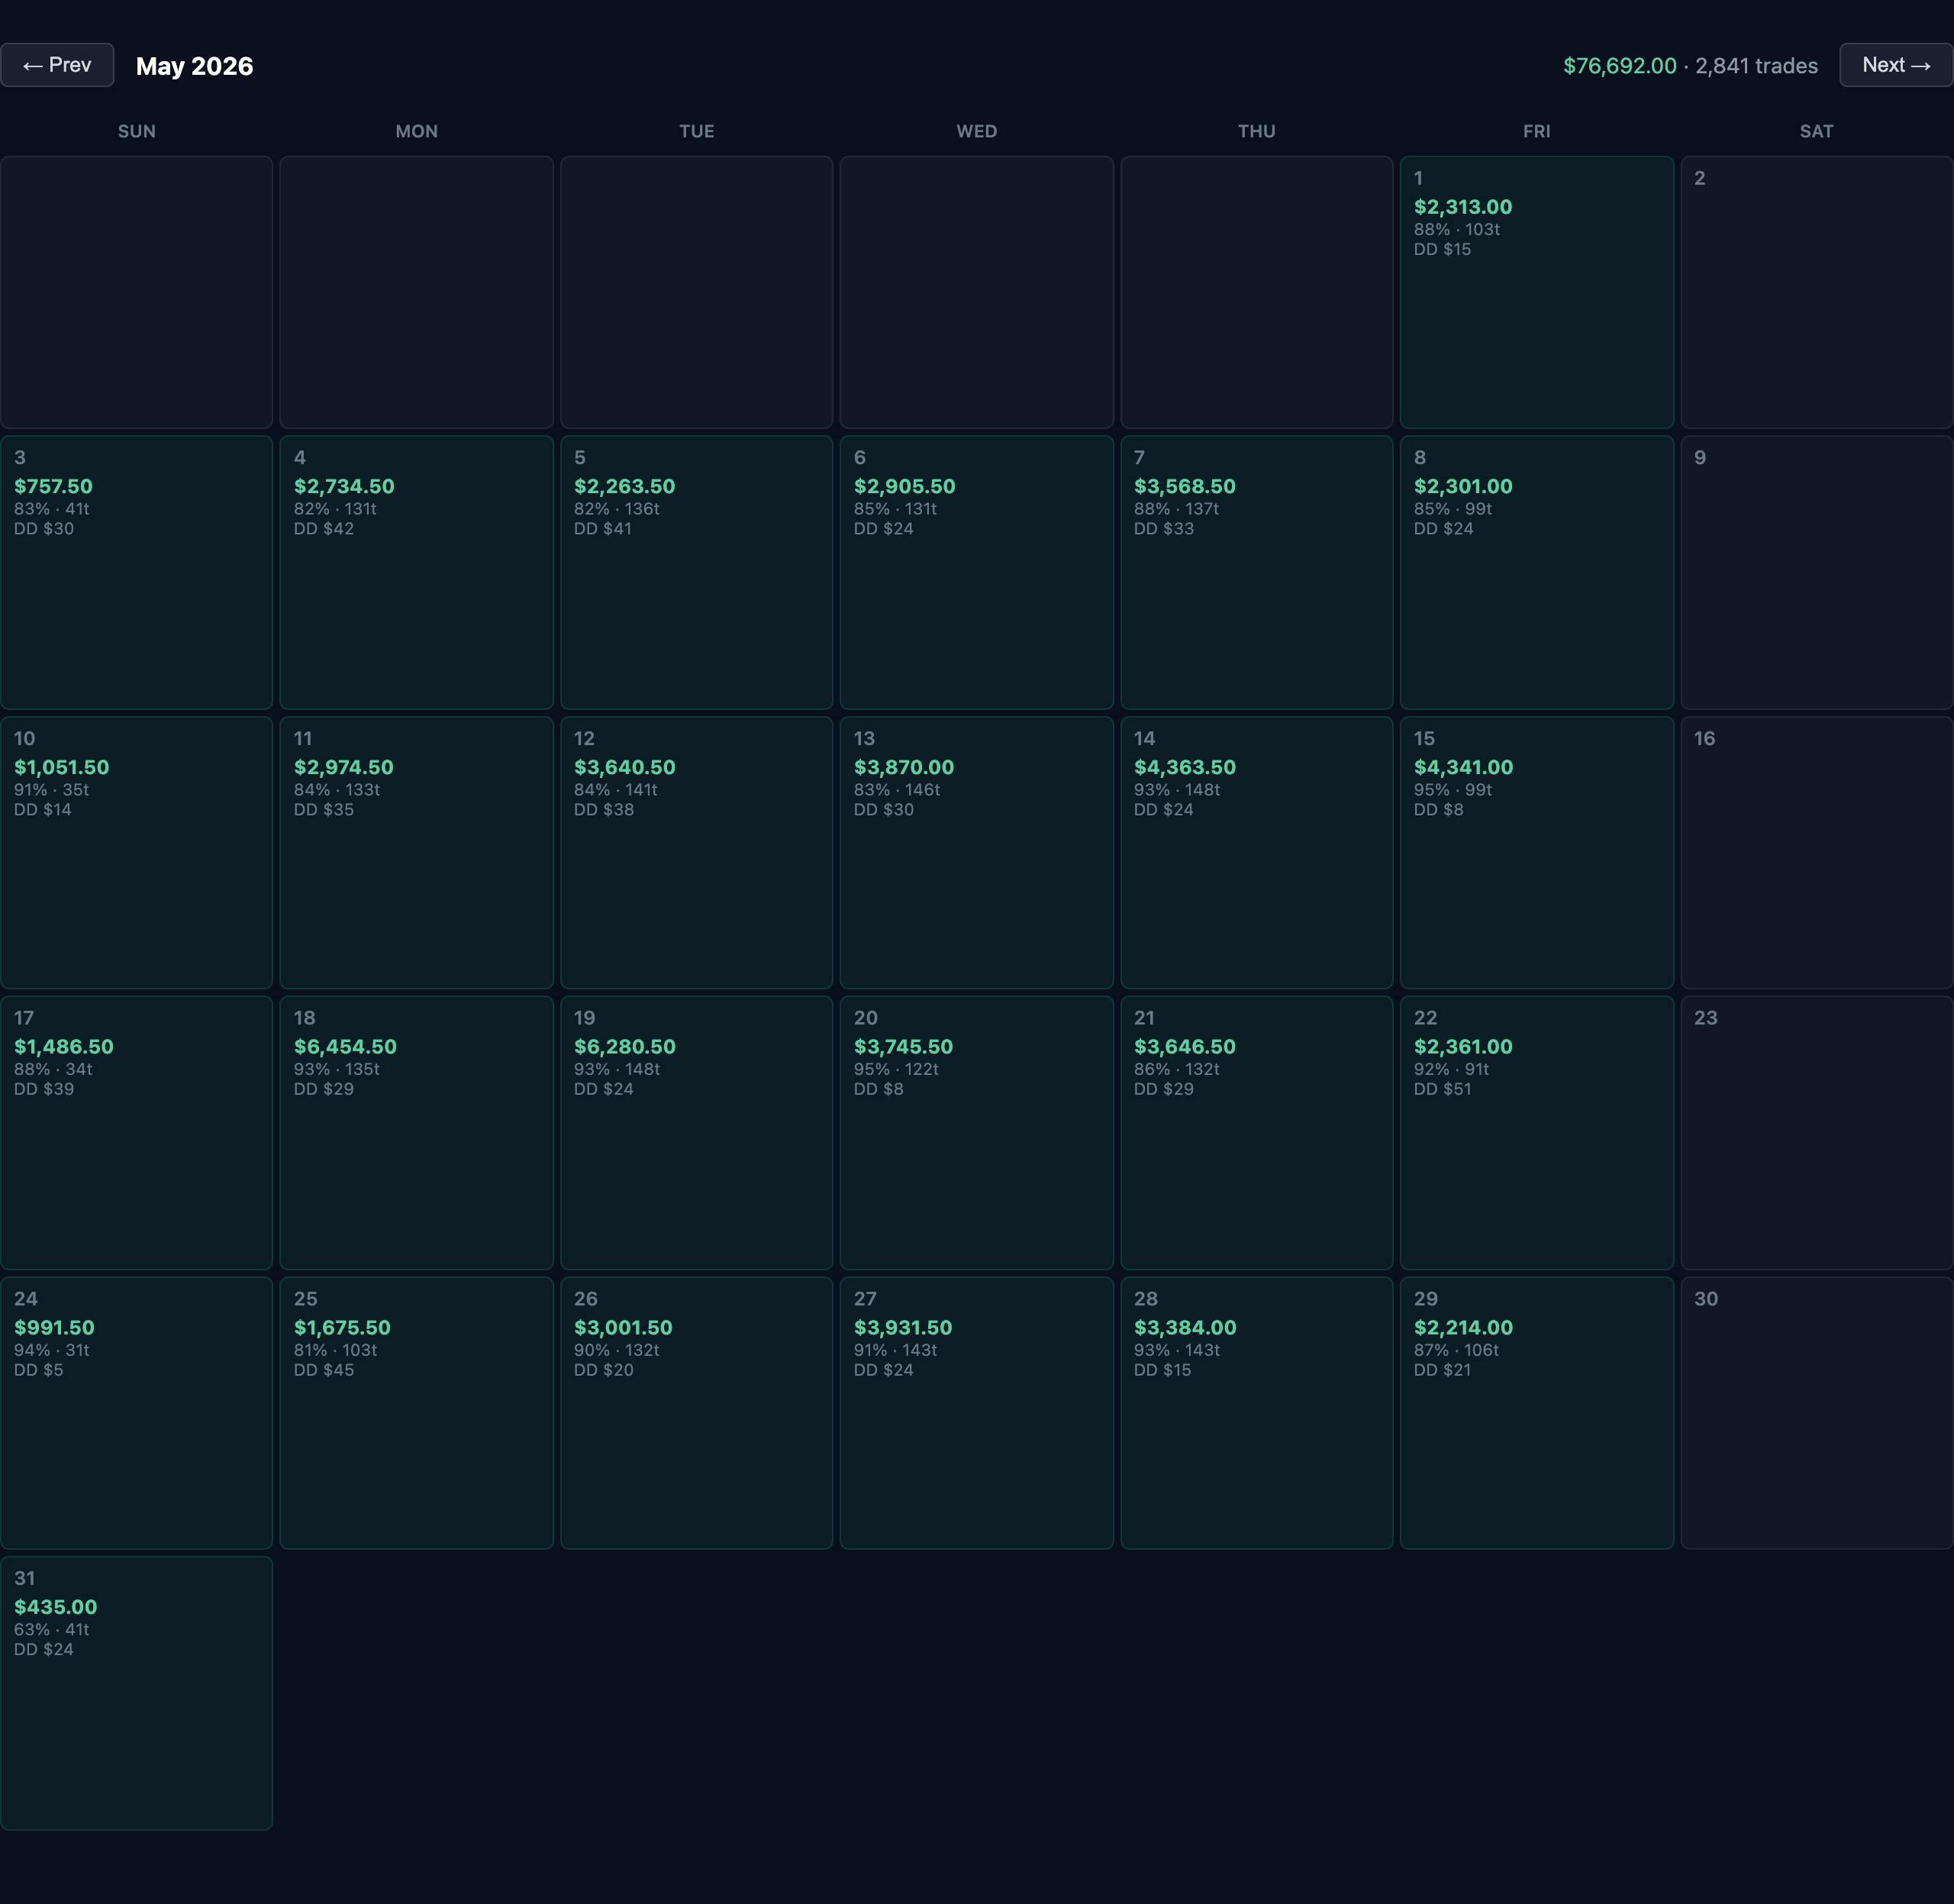
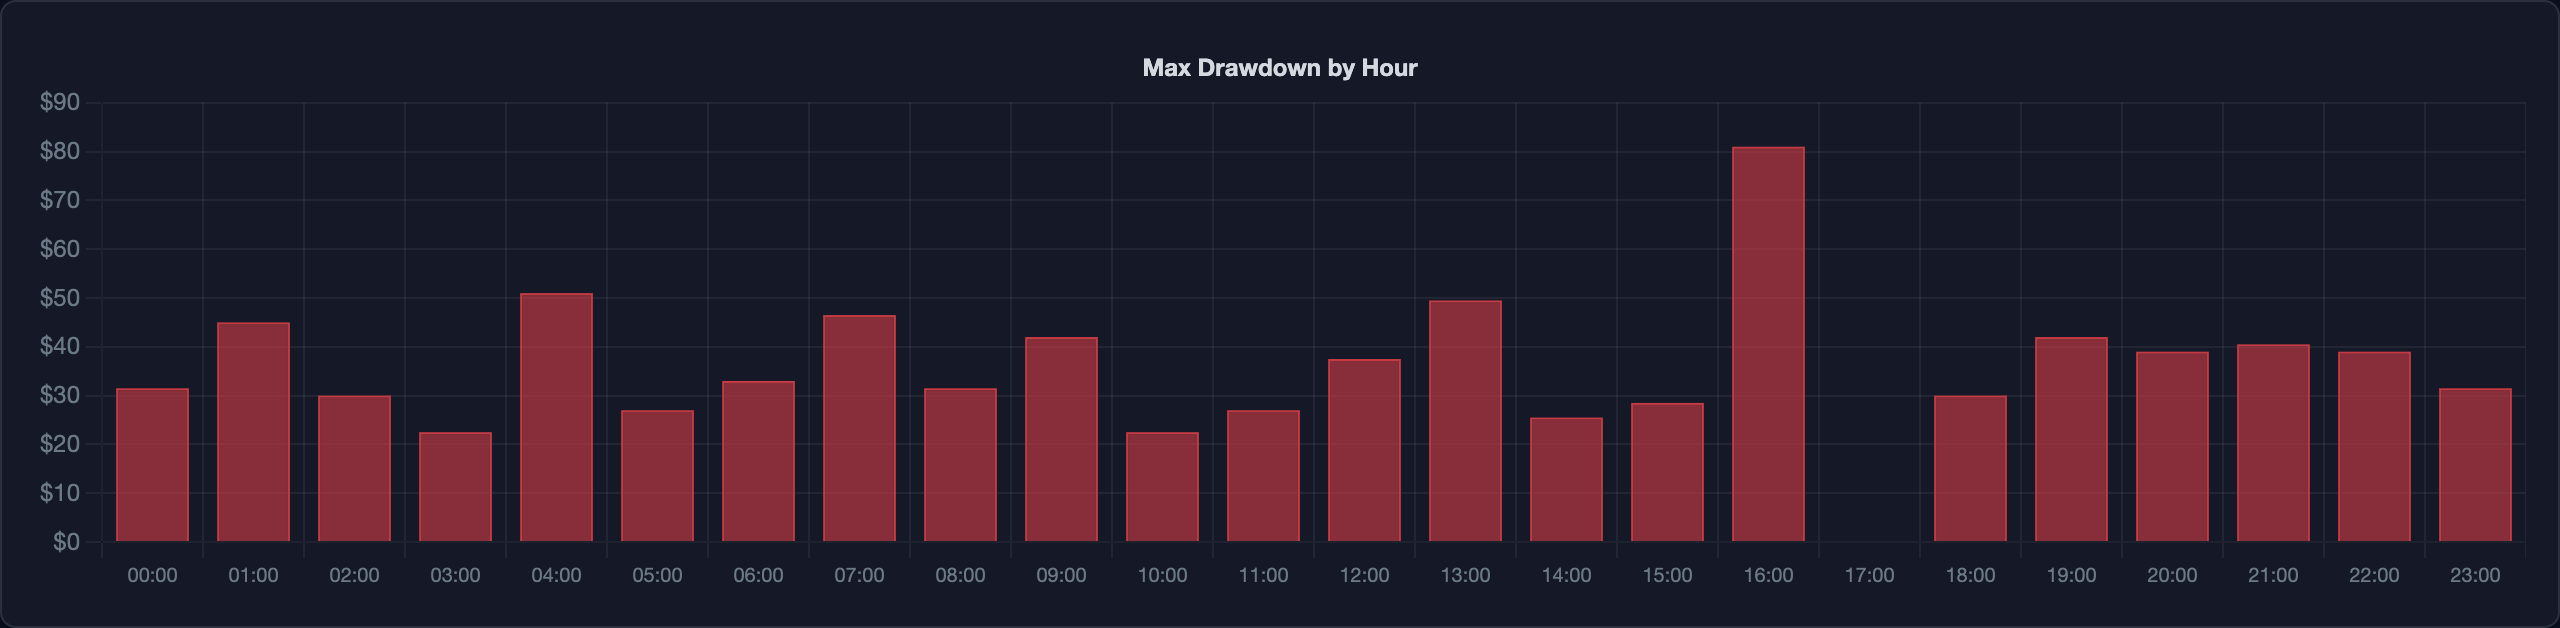
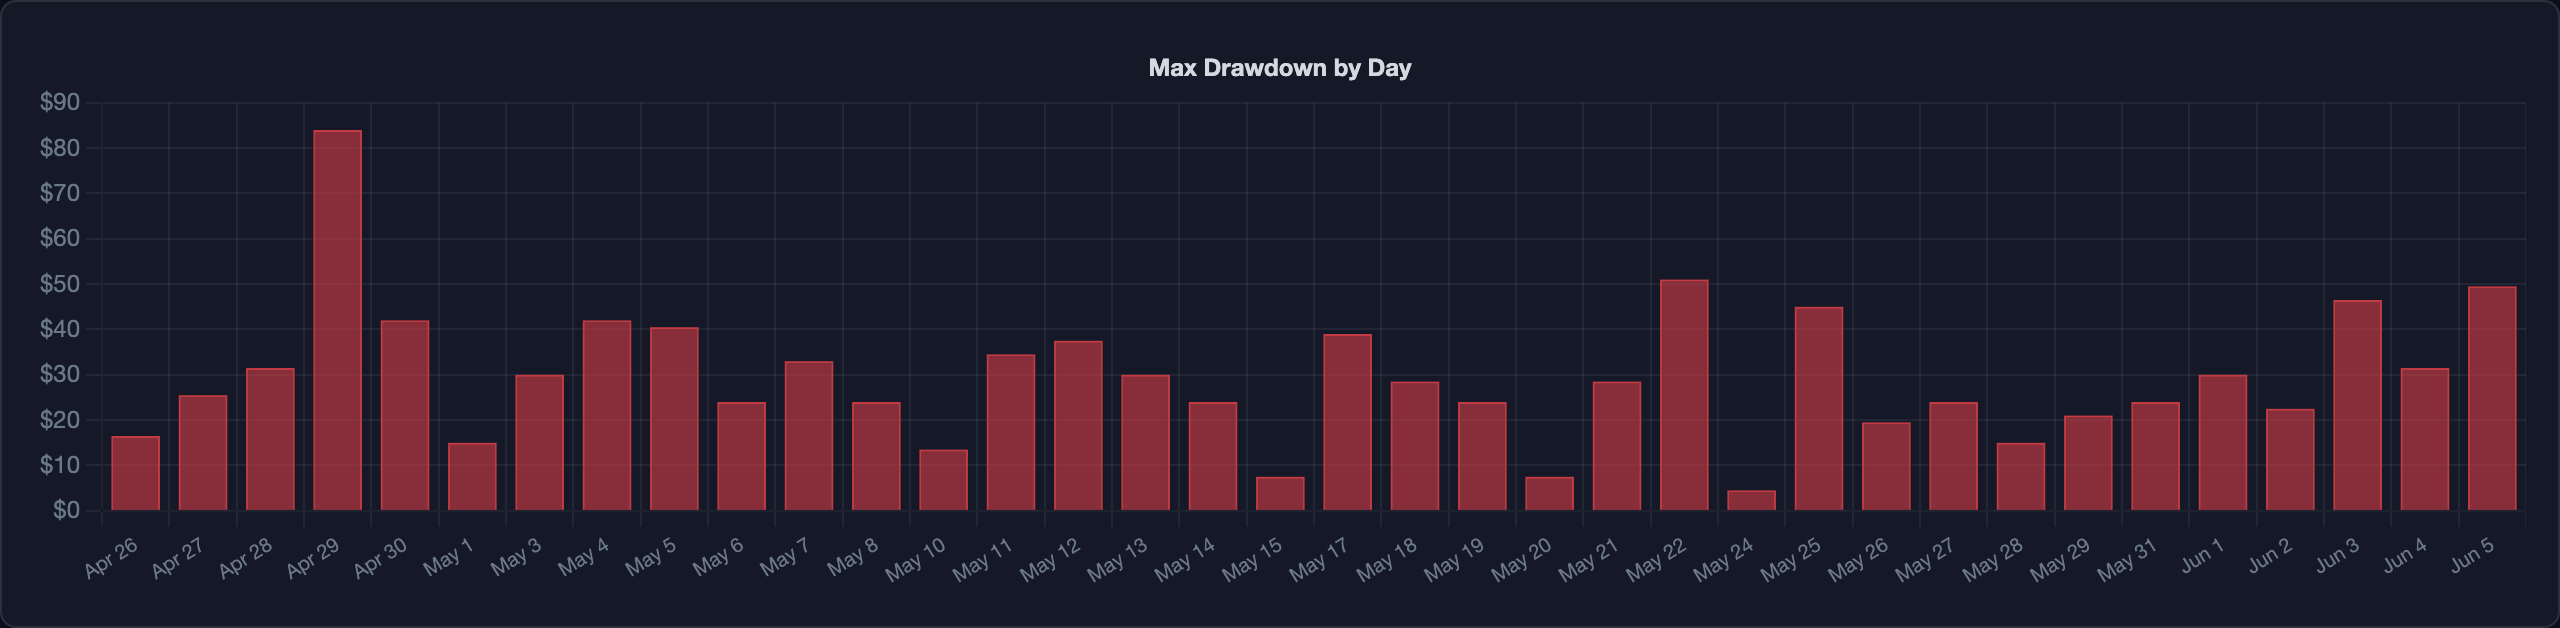
Know when the pain shows up
Max drawdown broken down by hour and by day, so you can see when your strategy takes its biggest hits and size your risk around them.
Save runs, compare versions
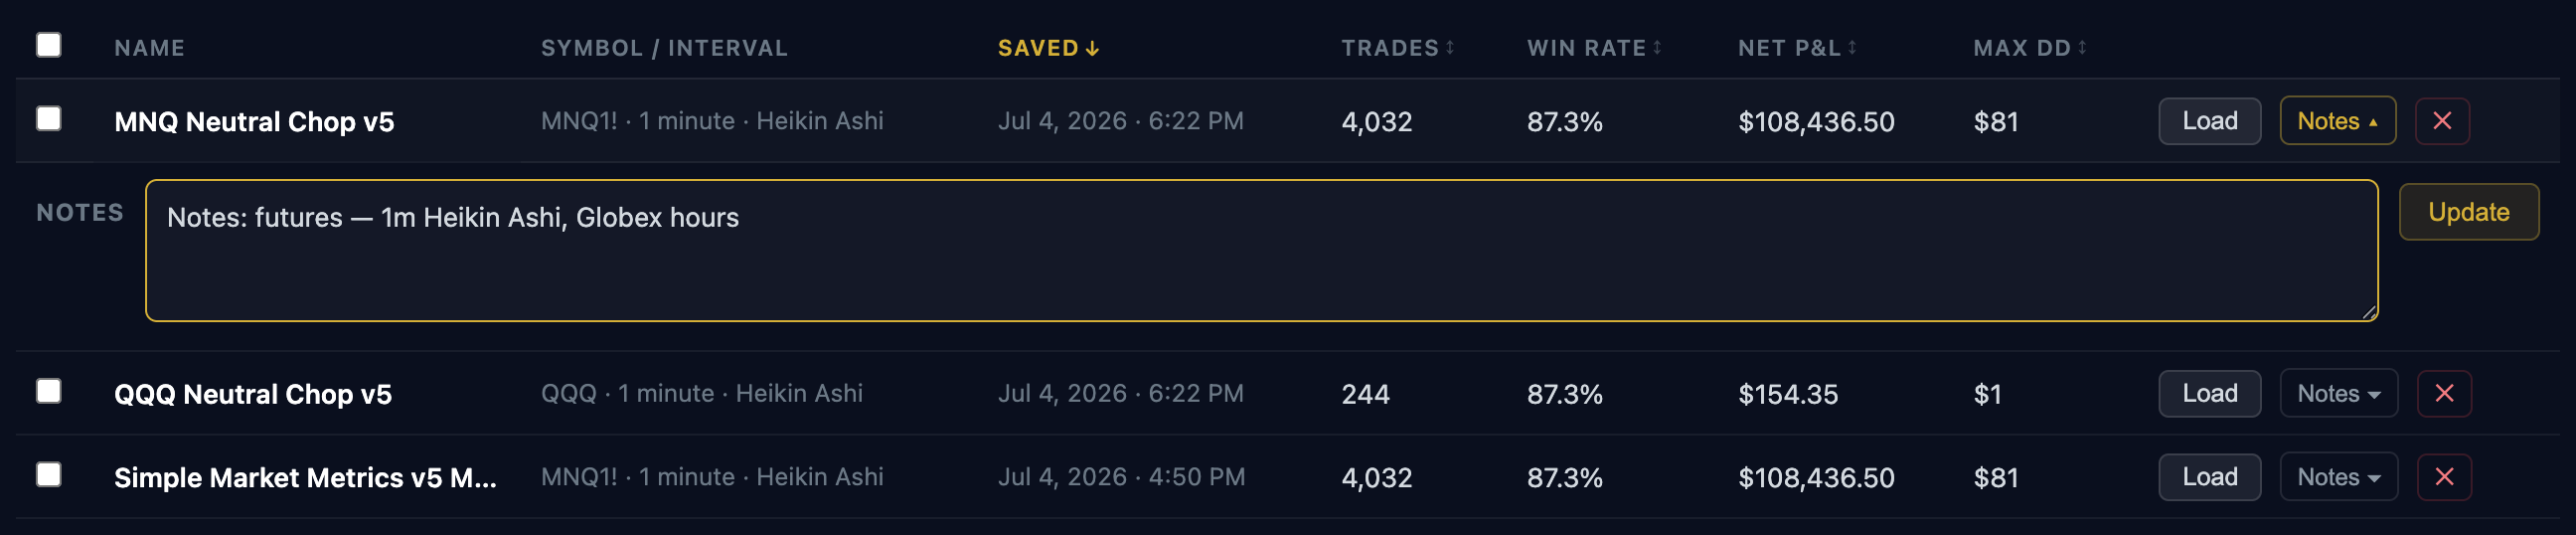
Save an analysis with its symbol, interval, and your notes: broker, direction filter, whatever you'll want to remember. Saved runs line up in a sortable table, so when you tweak the strategy and re-test you can see whether v6 really beats v5. Load any run back with one click.
From export to insight in under a minute
Export from TradingView
Open the Strategy Tester on any chart, click the strategy name dropdown, and choose Download data as XLSX.
Upload your export
Drop the .xlsx onto the analyzer. Analysis runs server-side in seconds. Your file is never stored unless you choose to save the results.
Explore & refine
Work through the tabs, build your best session, and save the run to compare against your next iteration.
Simple plans, full access
Both plans include everything. The annual plan just costs less.
Choose a plan
7-day free trial on all plans. Cancel any time.
Common questions
Do I need a paid TradingView plan?
Yes, and that one is on TradingView, not us. The analyzer needs the full Strategy Tester workbook ("Download data as XLSX"), and TradingView only offers that export on paid plans (Plus and above). Free TradingView accounts can't produce the file.
How do I export the right file?
Open the Strategy Tester on your chart, click the strategy name dropdown on the left of the panel, and choose Download data as XLSX. Heads up: the per-tab Download buttons give you partial CSVs that won't work. It has to be the full .xlsx report.
Is my backtest data stored?
Your file is analyzed in memory and never stored. If you save an analysis, we keep the computed stats and your notes, not the file, and you can delete saved runs any time.
What markets and strategies does it work with?
Any TradingView strategy on any symbol: futures, stocks, crypto, forex. If the Strategy Tester can run it, the analyzer can break it down.
How does the free trial work?
New subscribers start with a 7-day free trial on either plan, so you won't be charged until it ends, and you can cancel any time from the billing portal in your account. The trial is available once per product. If you subscribed before and cancelled, you can resubscribe any time, but you'll be billed right away instead of getting another trial.